library(earth)
data(etitanic)
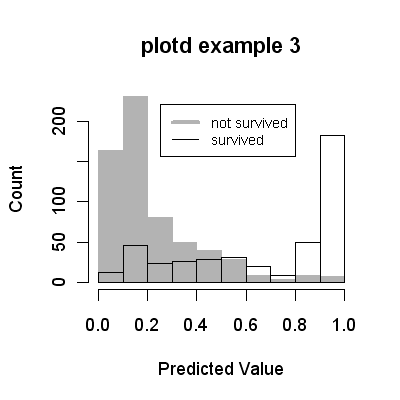
# we use an earth model here, but plotd works with any model
fit <- earth(survived ~ ., data=etitanic, degree=2, glm=list(family=binomial))
plotd(fit, main="plotd example 3", type="response", hist=TRUE,
legend.pos=c(.25,220))