library(earth)
library(gam)
data(airquality)
airquality <- na.omit(airquality) # plotmo doesn't know how to deal with NAs
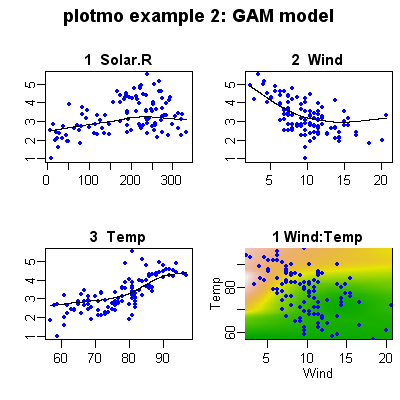
plotmo(gam(Ozone^(1/3) ~ lo(Solar.R) + lo(Wind, Temp), data=airquality),
caption="plotmo example 2: GAM model",
pt.pch=20, pt.col="blue",
type2="image", ngrid2=100, image.col=terrain.colors(100))