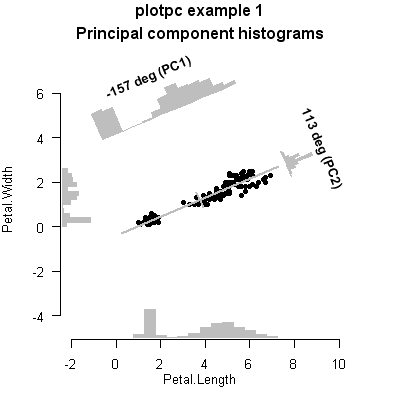
library(plotpc)
data(iris)
x <- iris[,c(3,4)] # select Petal.Length and Petal.Width
plotpc(x, main="plotpc example 1\nPrincipal component histograms\n")