Back to graph gallery
plotpc help page
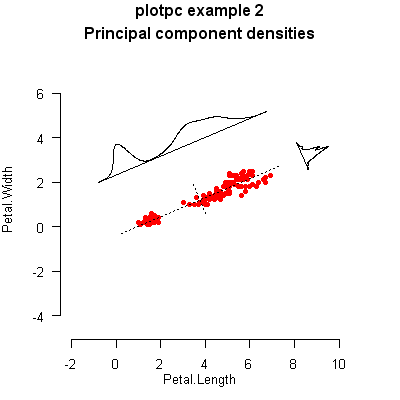
Code
library(plotpc)
data(iris)
x <- iris[,c(3,4)] # select Petal.Length and Petal.Width
# example with some parameters and showing densities
plotpc(x,
       main="plotpc example 2\nPrincipal component densities\n",
       hist=FALSE,          # plot densities not histograms
       gp.points=gpar(col=2, cex=.6), # small red points
       adjust=.5,           # finer resolution in the density plots
       gp.axis=gpar(lty=3), # gpar of axes
       heightx=0,           # don't display x histogram
       heighty=0,           # don't display y histogram
       text1="",            # text above hist for 1st principal component
       text2="",            # text above hist for 2nd principal component
       axis.len2=4,         # length of 2nd principal axis (in std devs)
       offset1=2.5,         # offset of component 1 density plot
       offset2=5)           # offset of component 2 density plot
Back to graph gallery