Back to graph gallery
plotpc help page
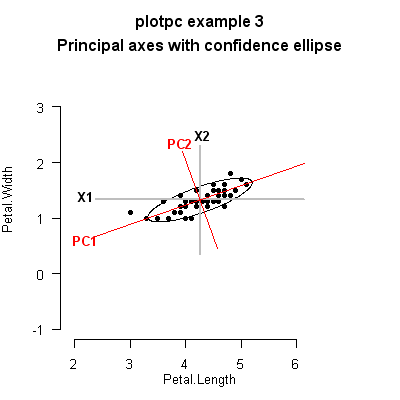
Code
library(plotpc)
data(iris)
x <- iris[iris$Species=="versicolor",c(3,4)] # select Petal.Length and Petal.Width
vp <- plotpc(x,
       main="plotpc example 3\nPrincipal axes with confidence ellipse",
       sd.ellipse=2,                       # ellipse at two standard devs
       heightx=0, heighty=0, height1=0, height2=0, # no histograms
       gp.ellipse=gpar(col=1),             # ellipse in black
       axis.lenx=4, axis.leny=5,           # lengthen horiz and vertical axes
       axis.len1=4, gp.axis1=gpar(col=2),  # lengthen pc1 axis, draw in red
       axis.len2=8, gp.axis2=gpar(col=2))  # lengthen pc2 axis, draw in red

pushViewport(vp) # add text to the graph
un <- function(x) unit(x, "native")
grid.text("PC1", x=un(2.2), y=un(.6),   gp=gpar(cex=.8, font=2, col=2))
grid.text("PC2", x=un(3.9), y=un(2.35), gp=gpar(cex=.8, font=2, col=2))
grid.text("X1",  x=un(2.2), y=un(1.4),  gp=gpar(cex=.8, font=2))
grid.text("X2",  x=un(4.3), y=un(2.5),  gp=gpar(cex=.8, font=2))
popViewport()
Back to graph gallery