Back to graph gallery
plotpc help page
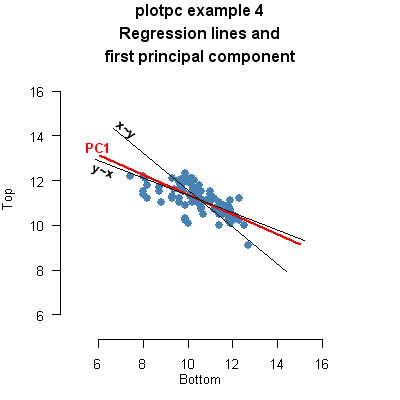
Code
library(plotpc)
library(alr3) # get banknote data
data(banknote)
x <- banknote[101:200,4:5] # select Forged, Top and Bottom
vp <- plotpc(x,
       main="plotpc example 4\nRegression lines and\nfirst principal component",
       heightx=0, heighty=0, height1=0, height2=0, # no histograms
       gp.points=gpar(col="steelblue"),      # color of points
       axis.len1=4,  gp.axis1=gpar(col=2, lwd=2),
       axis.len2=0,                          # no pc2 axis
       yonx=TRUE, xony=TRUE)                 # display regression lines

pushViewport(vp) # add text to the principal component line
grid.text("PC1", x=unit(6, "native"), y=unit(13.5, "native"),
          gp=gpar(col=2, cex=.8, font=2))
popViewport()
Back to graph gallery